ENERGY EFFICIENCY BENCHMARK
Gain a comparative perspective on your portfolio’s energy performance
The Granlund Manager Energy efficiency benchmark is an AI-powered tool that gives you access to comprehensive comparative data. Understand how your properties perform in against similar buildings.
Energy efficiency benchmark data across building types
The Energy efficiency benchmark tool gives you access to a broad dataset for comparing energy consumption across typical property types. What used to require time-consuming manual analysis is now available at the push of a button.
AI-powered benchmarking and clearly presented data introduce a new level of insight. Making data-driven decisions on resource allocation, upcoming improvements and repair needs is easier than ever before.
Granlund Manager helps you understand the energy efficiency of your buildings in a broader context – enabling informed corrective action.
Who are the power users of the Energy efficiency benchmarking tool?

Property Owner
Easily compare the energy performance of different building types and entire property portfolios, side by side.

Real Estate Manager
Gain a portfolio-level view of energy efficiency and identify properties that fall outside the norm.

Energy Specialist
AI-powered analysis makes it simple to assess your portfolio’s energy performance using accurate and reliable data.
How does it make your life easier?

Instant performance snapshot
Get access to high-quality, comparable energy consumption data and quickly see how your property portfolio performs against similar buildings.

Robust benchmarking dataset
The tool draws from energy consumption data of tens of thousands of buildings within Granlund Manager.

30+ building classifications
Comparison data is available for over 30 officially classified building types, including schools, offices, retail and healthcare buildings.

Climate-adjusted results
Regional climate differences are factored in – heating demands in Lapland are not the same as in warmer climates.

AI-powered benchmarking to support smarter property management
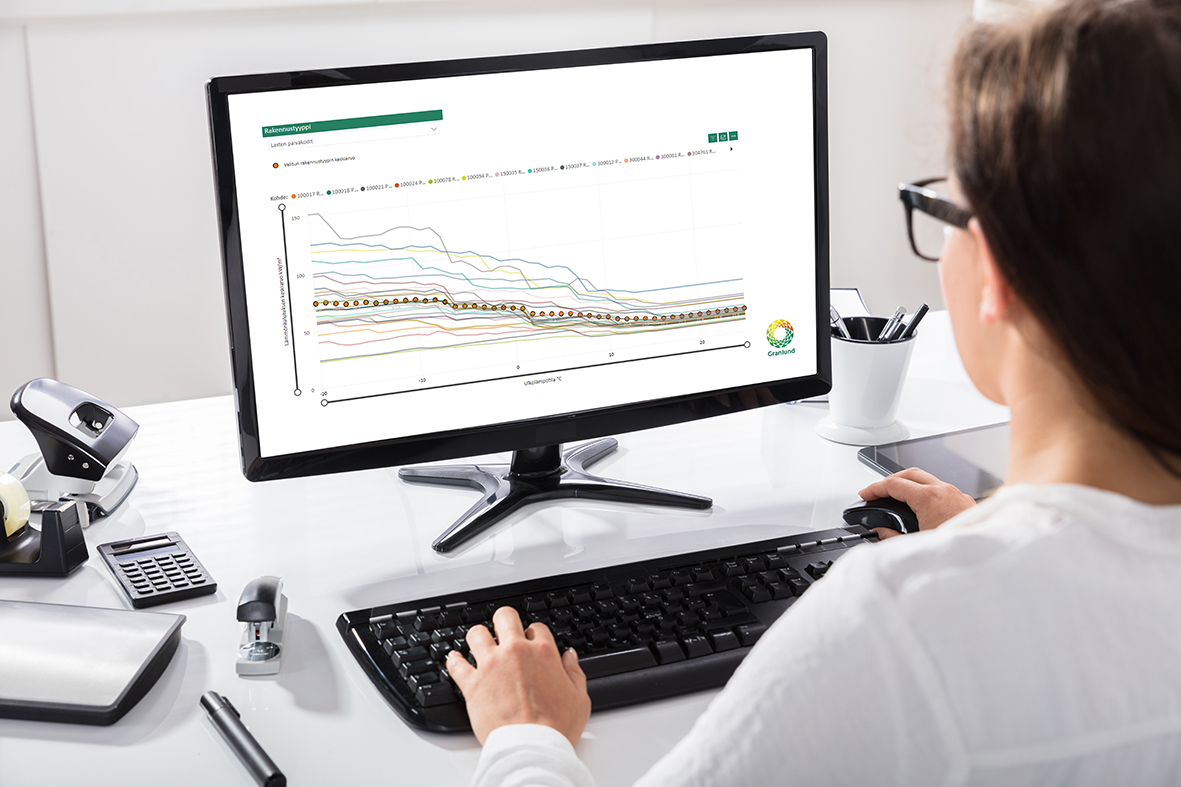
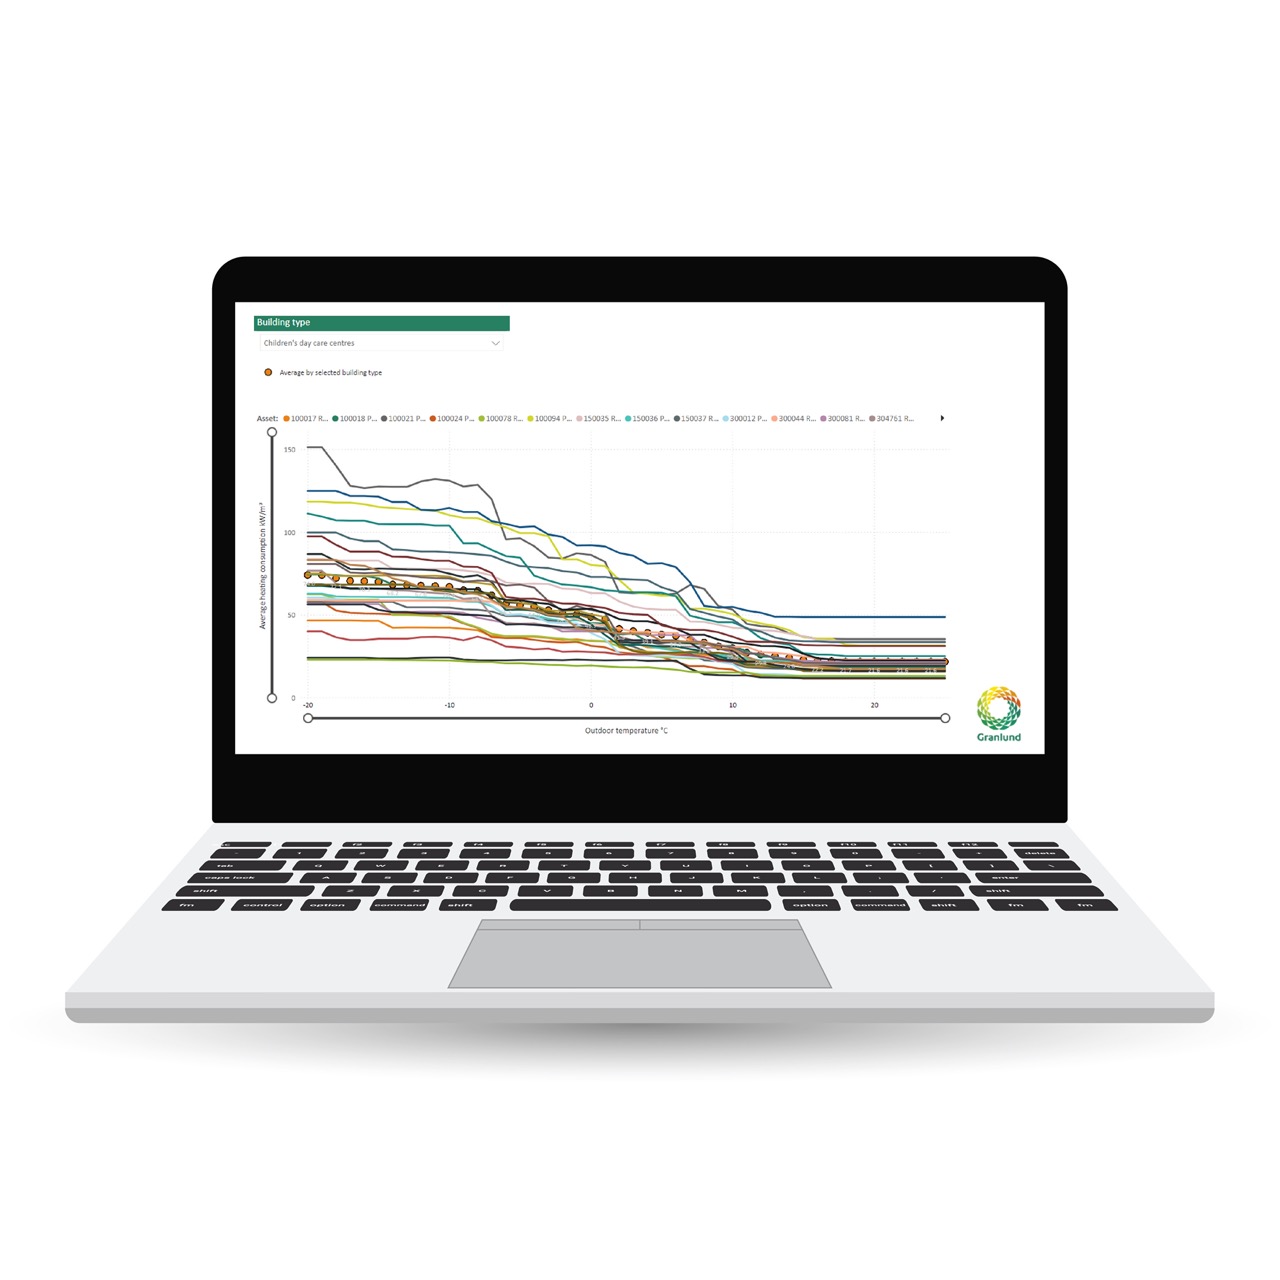
The Energy efficiency benchmark graph clearly highlights properties with unusually high or low energy consumption compared to peers, pinpointing where corrective action is needed to improve performance.
Reliable benchmarking supports truly data-driven property management by helping you direct resources where they deliver the most value. Clearly presented insights make it easier to justify future investments on the path towards operating truly energy efficient buildings.
Benchmark data also helps set realistic targets by identifying what constitutes average energy consumption for similar properties.
A complete toolkit for energy management and ESG performance
Energy Efficiency Benchmarking is just one of the many tools available in the Granlund Manager ESG solution. Explore the full suite to see how it can simplify your everyday work and support your sustainability goals.

Granlund Manager references


Searching for for more efficient real estate management?
Manage your property lifecycle with data-driven clarity.
Contact our global sales team
Want to get in touch with us? Find your local Granlund Manager representative below or contact the global team. Give us a call or send us an email and we will get back to you as soon as possible.
Global team

Otto Åkerberg

Mika Virkki

Topi Korpela
Sales partners
Estonia

Ivo Kivirand
Lithuania & Latvia

Lukas Barkauskas
Request a quote or a demo
Granlund Manager Customer service centre
Ran into a challenge or need support? Please contact our customer service team at: granlundmanager@granlund.fi